Raspberry Pi project – a milestone

After updating the humidity correction factors and clearing the log, I’ve now got a month’s worth of temperature and humidity data in the logs.

You can see that the upstairs temperature was much higher at the beginning of the period.  (click on the image to see the full size version)  That’s because I was there and was running electric heaters upstairs.  The temperature began to fall while I was getting ready to head home and turned them off – they are unplugged when I’m not there.  Seems smart to not risk an electrical problem and a fire when there’s no need for heating.

You can also see the daily temperature swings, more pronounced on some days than others.  The swings are larger when the sun is out, as you would expect.  The downstairs swings are not as big, because the windows have blinds (and there are only 2 windows downstairs vs 5 windows upstairs) so solar heating has less of a chance to warm things up downstairs.

The humidity is still higher than expected – I’ll need to recheck the sensors with the hygrometer and see if the numbers are still close.  Even if I wind up making a change to the humidity correction factors I don’t plan to restart logging.

Yes, it’s pretty cold inside right now.  That’s what happens when the only heat is a portable electric heater.

I’m sure you won’t be surprised by this, but I also made a couple of tweaks to the heat and cold alert functions in the python logger script.  When a heat or cold alert is rescinded, the email message includes the amount of time the alert was in effect.  Just a little more polish to the project.

Raspberry Pi project – tweaks

My temperature monitoring project has been running very well, especially since I corrected the humidity sensor readings by applying a correction factor.  And the upstairs temperatures did drop below freezing a couple of days ago, so the tasks of shutting off the pump, draining the plumbing, and adding antifreeze in the traps were absolutely worthwhile.

But I decided that it would be nice to know when some threshold temperatures were reached without checking the web page.  I added code to the python3 logger script to write a file when a cold or heat threshold was reached.  It also sends an alert email message when this happens.  The web page that displays the temperature and humidity graphs looks for this file and indicates that a threshold has been crossed for cold or hot temperatures.

It seems the DHT22 sensors can waver back and forth a few tenths of a degree, and if that happens right at one of your threshold values, you will get an annoying collection of emails.  To address this, I implemented a buffer mechanism.  Now, the heat/cold alert will only happen when the temperature crosses the threshold and stays there for 3 consecutive checks.  Since I’m logging the values every 5 minutes, that means the temperature must remain either above (heat) or below (cold) for at least 10 minutes before an alert is sent.  When the temperature rises above the cold threshold, it must remain above the threshold for 3 consecutive checks before the alert is rescinded.  Rescinding a heat threshold works the same way.

I also added some code to rescind any existing cold or heat alerts when the logging daemon is restarted.  Since you can edit the threshold temperatures, it seems reasonable to start clean.  If an alert should be issued, it will take just a few minutes to get past the buffer mechanism.

So far this is working well.  On my next trip up there, I’ll recheck the sensors using the hygrometer and see if any alterations to the correction factors are needed.  If they are, it’s a trivial change to make.

Raspberry Pi project – some conclusions

After making the changes discussed earlier and monitoring the values and the graphs of those values, I can draw some conclusions about the interior conditions at the cabin.

First, conditions downstairs are more stable than the upstairs, both temperature and humidity do not fluctuate nearly as much as they do upstairs.  Makes sense as there are only two small windows downstairs, while the upstairs has five windows.

Second, it is cooler upstairs than downstairs – but a larger difference than I would have expected.  It is 4-5 degrees cooler upstairs, and more humid by 4-5 percent.  Some of the humidity difference is attributable to the temperature difference, but not all of it.  Solar heating during the day does warm the upstairs more than the downstairs – presuming that the sun can supply the solar energy.  On cloudy days, you’re on your own.

But my main interest was to see how close to freezing it gets inside, with no heat source to maintain a set temperature.  I can’t risk frozen pipes, so I drain the water system and put RV antifreeze in the traps and the toilets.  Maybe I’ve been wasting time and RV antifreeze when it isn’t really needed, but now I have a reasonably reliable way to monitor the situation.

Raspberry Pi project – correction factors

As I mentioned earlier, I was suspect of the humidity values returned by the DHT22 sensors.  So I used a hygrometer to get a separate reading – not that the hygrometer is perfect, but my experience over the past couple of weeks was that it agreed with another hygrometer, the temperature and humidity were consistent, and believable for cool winter conditions.

I placed the hygrometer close to the sensors and gave it a couple of hours to settle in.  The temperature matched within a degree, so that’s great.  Not so great on the humidity side, I applied a correction factor of -16 to get the reported values in the ballpark.  Now the sensors are both reporting values that match the hygrometer within a percent.  A significant improvement.

To move one of the sensors upstairs, I took some cat6 cable and soldered the twisted pairs together to make a 4 conductor cable.  One conductor won’t be used with the DHT22 sensors, but I will need it for the BME280 sensors when I swap them.  I ran the cable upstairs, which took a lot longer than it took to type this sentence.  It’s a long story, don’t ask.  Connected everything up and booted the pi.

Upstairs temperature was fine, but the humidity value (again) was off the charts.  So I decided to try the +5v pin instead of the +3.3v pin on the pi for the upstairs sensor, as the connecting wire is now about 15 feet long.  The humidity value came back to reality and has stayed that way for a few days now.

I’ll leave the DHT22 sensors in place for now and see how they behave.  I am definitely going to swap the sensors, but there are higher priority tasks to do, especially since the current sensors seem to be behaving for now.

Raspberry Pi project – swapping sensors, part 2

Now that I’ve laid out my reasons for trying a different type of sensor, let’s dig in.  We need a couple of libraries that the DHT22 sensors didn’t need, so we should go ahead and get them installed.

First, let’s install the smbus2 library. At a command prompt, type:

sudo pip install smbus2

Now, let’s install the library for the SME280 sensor. At a command prompt, type:

sudo pip install RPi.bme280

That takes care of the additional libraries we’ll need for the python script.

Now, let’s connect the sensors to the Raspberry Pi. I’m using the model 4 rev B, so I have a 40-pin GPIO header. We’re going to use six pins to connect our two sensors. We’re going to connect each sensor to it’s own 3.3v source and it’s own ground. We’ll use RPi4 pins 1 and 6 for 3.3v and ground for the upstairs sensor, and pins 17 and 9 for 3.3v and ground for the downstairs sensor. We’ll connect the two clock lines together and they will connect to RPi4 pin 5; then we’ll connect the two data lines together and they will connect to RPi4 pin 3.  Since the two sensors will have a unique address on the bus, we can connect them electrically but interrogate them separately.

We also need to make a small alteration to one of the sensors to change it’s address on the i2c bus.  In the following image, the red mark indicates the we are removing the connection between the left and center pad, and adding a connection from the center pad to the right pad.  We are only altering one of the two sensor boards in this manner.  The unaltered sensor will have bus address 0x76, and the altered sensor will have address 0x77.  The test script below is coded so that the upstairs sensor is the unaltered one, and the altered sensor is the downstairs sensor.

This sensor test script interrogates the sensors and then displays the returned values separately, followed by a string containing the data. Note that python is sensitive to indentation. I’ve added a line of code to convert the celcius temperature into fahrenheit. This line is optional. The full code for our test script follows.

#!/usr/bin/python3

import time
import smbus2
import bme280

port = 1
upstairs_addr = 0x76
downstairs_addr = 0x77
bus = smbus2.SMBus(port)

calibration_params_upstairs = bme280.load_calibration_params(bus, upstairs_addr)
calibration_params_downstairs = bme280.load_calibration_params(bus, downstairs_addr)

#exit()

while True:
    # interrogate the sensors and supply the calibration data we obtained earlier
    upstairs_data = bme280.sample(bus, upstairs_addr, calibration_params_upstairs)
    downstairs_data = bme280.sample(bus, downstairs_addr, calibration_params_downstairs)

    # the compensated data
    print(upstairs_data.id)
    print(upstairs_data.timestamp)
    print(upstairs_data.temperature)
    ftemp_upstairs = upstairs_data.temperature * 9/5.0 + 32
    print(ftemp_upstairs)
    print(upstairs_data.pressure)
    print(upstairs_data.humidity)

    # in string format
    print(upstairs_data)

    # the compensated data
    print(downstairs_data.id)
    print(downstairs_data.timestamp)
    print(downstairs_data.temperature)
    ftemp_downstairs = downstairs_data.temperature * 9/5.0 + 32
    print(ftemp_downstairs)
    print(downstairs_data.pressure)
    print(downstairs_data.humidity)

    # in string format
    print(downstairs_data)

    time.sleep(15)

Once this is working and successfully retrieving and displaying the sensor data, we’ll move on to the changes needed to our data logger script.

Raspberry Pi project – swapping sensors

I’m a little suspect of the humidity readings I get from the DHT22 sensors.  I suspect that they’re reporting higher humidity than is actually the case.  I did some research and I’m not alone in this concern.  It’s not a huge concern by any means, my primary interest is with temperature, but since I’m logging and graphing the data, why not try to make the data as accurate as possible?

That research led me to the BME280 sensor module.  It communicates through the i2c bus, using an address on the bus to differentiate between multiple devices on the same bus.  The BME280 has two available addresses depending on how a jumper on the module is configured.  Since I’m using two sensors that will work out well.

The difference that you’ll need to deal with first is that the BME280 sensors use four connections to the Pi, not three as the DHT22 sensor does.  So you’ll need an extra wire between the sensor and the Pi.

Normally you’d use a breakout board to easily handle the multiple connections needed, but because I don’t foresee adding other sensors at this point, I’m just going to solder the wires for data and clock together.  I’ll continue to use separate 3.3v and ground connections for each sensor.  If that changes, I can easily add a breakout board later.

The python script that interrogates the sensors and saves the data into the rrdtool database will require some changes.  These sensors have calibration data available, and we’ll use that to be sure the readings are as accurate as possible.  We’ll also need different libraries to use the i2c bus and to communicate with the BME280 sensors.  Both of these libraries can easily be installed using pip.


Raspberry Pi project – integration

Ideally, the logging / data storage script would run automatically, as would the graph image generation script.  There are multiple ways to make that happen, and some of them will vary depending on your operating system.

The simplest way is to just run the scripts a a scheduled process using cron.  If you do this, you should remove the endless loop and sleep commands from the scripts.  Since cron will execute the scripts on the schedule you choose, there is no need for the script to sleep and then wake up and run through a loop again.

If you choose to run them through cron, you’ll need to run the logging / data storage script every 5 minutes, so the minute parameter in your cron file will be “*/5”, meaning every 5 minutes.  The other timing parameters will be simply “*”.

For the graph image generation script, you would probably run it once each hour.  To run it at the top of the hour, set the minute value to “0”, and the other parameters to “*”. That means cron will run the script every time the minute is 0 (top of the hour).

Since I like the scripts to run as system services, my scripts have the loop and sleep commands in them.  On a linux operating system using systemd, you’ll create a system service for running the scripts. To do this you need root access – either switch to the root user or use sudo.  Go to the /etc/systemd/system directory, and create a file name temperature_logger.service.  Put the following code in it, adjusting the path to the file as required for your environment.

After=network.service

[Service]
ExecStart=/<path-to-your-script>/temperature_logger.py

[Install]
WantedBy=default.target

This file should be owned by root, with 644 permissions.

To activate this as a system service, type “systemctl enable temperature_logger.service”, followed by “systemctl start temperature_logger.service”. This will now start automatically when the computer is booted. To stop it from running, type “systemctl stop temperature_logger.service”. Note that it will restart if the computer is rebooted. If you don’t want it to start unless you start it, type “systemctl disable temperature_logger.service”.

Setting up the graph image generations as a system service is basically identical, except that the service file will have a different name, and the file name on the ExecStart line will be different.

It is your preference as to how you want to execute these scripts. Other OSes will offer different methods that give the same result.

To rotate the log file, we need to add a file into the /etc/logrotate.d/ directory. The name isn’t critical; I chose “mylogs” to differentiate it from the files added when other packages are installed. Presuming that you left the name of the log file as it was in the example code, here is what you’ll need to add.

/var/log/temp_humidity.log {
    su root adm
    daily
    missingok
    rotate 7
    delaycompress
    compress
    notifempty
    create 644 root adm
    sharedscripts
    postrotate
    endscript
    maxage 7
}

This will keep 7 days worth of log files. The current log file and yesterday’s file are not compressed, the other log files are compressed to save space.

I hope you’re found this little project documentation useful. You could extend it by adding another sensor, perhaps locating this one outdoors. The documentation says that the sensor can be connected to the Raspberry Pi by wires as long as 50 yards, so you have some flexibility as to where you place it.

Raspberry Pi project – pretty graphs

Now that we’re saving data into the rrd database, let’s make some graphs so we can see what happens over time to the temperature and humidity values. I chose to use php for this part of the project, as there is a php module for rrdtool that works quite well. We’ll create 5 graphs, Hourly, Daily, Weekly, Monthly, and Yearly. We can also add text to the graphs to show the maximum, average, and minimum values for the time period being displayed.

#!/usr/bin/php -q
<?php


while (true) {

    $f = fopen("/var/log/temp_humidity.log", "a+");
    fwrite($f, date('Y-m-d H:i:s')." generate graph images begin\n");

    create_graph("/var/www/html/temp/temp-hour.png", "-1h", "Woodsmor Cottage - Hourly", $f);
    create_graph("/var/www/html/temp/temp-day.png", "-1d", "Woodsmor Cottage - Daily", $f);
    create_graph("/var/www/html/temp/temp-week.png", "-1w", "Woodsmor Cottage - Weekly", $f);
    create_graph("/var/www/html/temp/temp-month.png", "-1m", "Woodsmor Cottage - Monthly", $f);
    create_graph("/var/www/html/temp/temp-year.png", "-1y", "Woodsmor Cottage - Yearly", $f);

    $output = null;
    $retval = null;
    exec('scp /var/www/html/temp/*.png xxxx@xxxxxxxxxxxx.com:/var/www/html/temp/.', $output, $retval);
    fwrite($f, date('Y-m-d H:i:s')." images copied to macbook with status $retval\n");
    //echo "Returned with output ".print_r($output, true)."\n";

    fwrite($f, date('Y-m-d H:i:s')." generate graph images complete\n");

    fclose($f);
    sleep(3600);

}

exit;

We start off in the same way as the other scripts, by telling the OS which interpreter should be used. Then we have an endless while loop to create the graph images.  The first thing we do is to log the start of the image creation process, using the same log file that the sensor data is using. Then we call a function “create_graph” that passes four parameters. The first is the full path and filename for the image, the second is time span the graph will cover, the third is the title of the graph, and the final is the handle for the log file. We call it five times, once for each graph image we want to create. Once the images have been created, I’m using SCP (SecureCoPy) to copy the images to the webserver from the pi. You might just serve them from the pi if you want. I have another computer on my local network that is running a webserver, so I decided the pi will just collect the data, save it, generate the images, and then copy them to the webserver.  At the end, we sleep for 3600 seconds (one hour), and then create the images all over again.

function create_graph($output, $start, $title, $f) {
    $date_time = date('F j, Y \a\t g:i a');
    // the : has special significance in graph variables, so it must be escaped
    $date_time = str_replace(':', '\:', $date_time);
    $options = array(
        "--width=800",
        "--height=200",
        "--imgformat=PNG",
        "--slope-mode",
        "--start", $start,
        "--title=$title",
        "--vertical-label=Temperature / Humidity",
        "DEF:utmax=/home/scripts/temp_humidity.rrd:uth_dht22:MAX",
        "DEF:uhmax=/home/scripts/temp_humidity.rrd:uhm_dht22:MAX",
        "DEF:dtmax=/home/scripts/temp_humidity.rrd:dth_dht22:MAX",
        "DEF:dhmax=/home/scripts/temp_humidity.rrd:dhm_dht22:MAX",
        "LINE1:utmax#ff0000:Upstairs Temperature",
        "LINE1:uhmax#ff9999:Upstairs Humidity",
        "LINE1:dtmax#0000ff:Downstairs Temperature",
        "LINE1:dhmax#9999ff:Downstairs Humidity",
        "COMMENT:\\n",
        "COMMENT:Generated ".$date_time
    );

    $ret = rrd_graph($output, $options);
    if (! $ret) {
        fwrite($f, date('Y-m-d H:i:s')." Graph error: ".rrd_error()."\n");
    }
}

?>

This is the function that does all of the heavy lifting. The first thing we do is to build a variable that contains the date and time in an easily-read format so that we can include the text in the graph image. That way we know when the graph was generated. We’ll use that value later.

To pass the options to the rrd_graph function, we build an array of values. We tell it the width and height (in pixels) of the image we want, and the format we want. “slope-mode” says we want a line connecting the data points. The time period is passed as a parameter, something like “-1h”. That means all data will be included starting from one hour ago. The graph title is also passed as a parameter.  There is a vertical label defined, but that is optional.

Then we define the four data fields we want to show on the graph. The first parameter in the DEF line is the variable name we will use in the options array, followed by the full path and name of the rrd file. The next parameter is the variable name used when we defined the rrd database. The fourth and final parameter is MAX, indicating that we want to graph the maximum value.

The four LINE1 parameters lay out the legend for the graph. First is the variable name we assigned in the DEF lines, followed by the rgb color values to describe the way the line color should appear. The final parameter is the label for the legend.

The output path and filename, and options array are passed to the rrd_graph function, and we get back a return code. If the graph function fails, we log the reason.

Here’s the complete script.

#!/usr/bin/php -q
<?php


while (true) {

    $f = fopen("/var/log/temp_humidity.log", "a+");
    fwrite($f, date('Y-m-d H:i:s')." generate graph images begin\n");

    create_graph("/var/www/html/temp/temp-hour.png", "-1h", "Woodsmor Cottage - Hourly", $f);
    create_graph("/var/www/html/temp/temp-day.png", "-1d", "Woodsmor Cottage - Daily", $f);
    create_graph("/var/www/html/temp/temp-week.png", "-1w", "Woodsmor Cottage - Weekly", $f);
    create_graph("/var/www/html/temp/temp-month.png", "-1m", "Woodsmor Cottage - Monthly", $f);
    create_graph("/var/www/html/temp/temp-year.png", "-1y", "Woodsmor Cottage - Yearly", $f);

    $output = null;
    $retval = null;
    exec('scp /var/www/html/temp/*.png xxxx@xxxxxxxxxxxx.com:/var/www/html/temp/.', $output, $retval);
    fwrite($f, date('Y-m-d H:i:s')." images copied to macbook with status $retval\n");
    //echo "Returned with output ".print_r($output, true)."\n";

    fwrite($f, date('Y-m-d H:i:s')." generate graph images complete\n");

    fclose($f);
    sleep(3600);

}

exit;

function create_graph($output, $start, $title, $f) {
    $date_time = date('F j, Y \a\t g:i a');
    // the : has special significance in graph variables, so it must be escaped
    $date_time = str_replace(':', '\:', $date_time);
    $options = array(
        "--width=800",
        "--height=200",
        "--imgformat=PNG",
        "--slope-mode",
        "--start", $start,
        "--title=$title",
        "--vertical-label=Temperature / Humidity",
        "DEF:ut=/home/scripts/temp_humidity.rrd:uth_dht22:MAX",
        "DEF:uh=/home/scripts/temp_humidity.rrd:uhm_dht22:MAX",
        "DEF:dt=/home/scripts/temp_humidity.rrd:dth_dht22:MAX",
        "DEF:dh=/home/scripts/temp_humidity.rrd:dhm_dht22:MAX",
        "LINE1:ut#ff0000:Upstairs Temperature",
        "LINE1:uh#ff9999:Upstairs Humidity",
        "LINE1:dt#0000ff:Downstairs Temperature",
        "LINE1:dh#9999ff:Downstairs Humidity",
        "COMMENT:\\n",
        "COMMENT:Generated ".$date_time
    );

    $ret = rrd_graph($output, $options);
    if (! $ret) {
        fwrite($f, date('Y-m-d H:i:s')." Graph error: ".rrd_error()."\n");
    }
}

?>

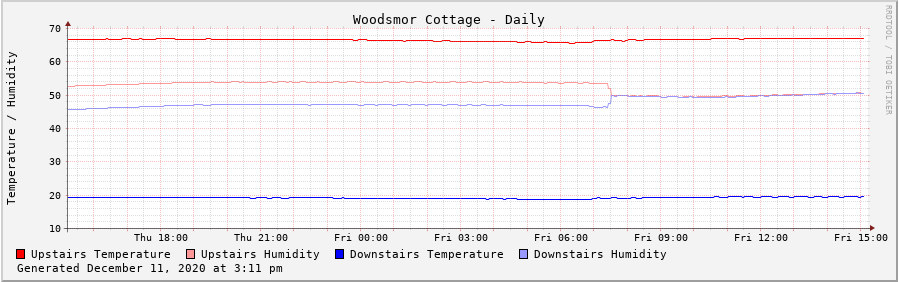
Here is the Daily graph image created from this script. You’ll notice that the humidity lines merge partway through the day – that’s when I implemented the correction code in the logging script. Also, note that the downstairs temperature is in centigrade, as I mentioned earlier. When this is running at the cabin, I’ll activate the line of code that converts the downstairs temperature to fahrenheit. I would expect the temperature and humidity values to track fairly closely to each other, but that’s one thing I’ll learn as it accumulates data.

Next, we need to integrate the logging script and the graphing script so that they run automatically.
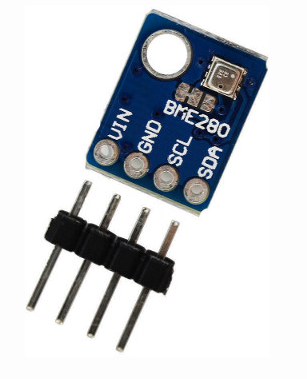
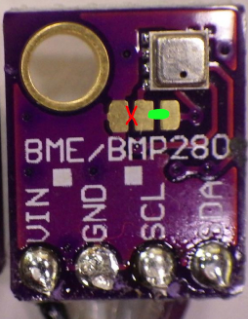
Raspberry Pi project – storing the values

Now that we’ve defined the database to save our temperature and humidity values, we need a process to query the sensor and update the database. I also decided to create a log file containing the values as it’s easier to see that the process is working properly in a log file. So our little python script that we used to test the sensors will be updated to save the values in the rrd database, and also write them to a log file.

#!/usr/bin/python3

import os
import time
import Adafruit_DHT as dht
import rrdtool
import datetime

DHT_SENSOR = dht.DHT22
U_DHT_PIN = 5
D_DHT_PIN = 6

while True:

It starts off the same, except that we need to include some additional modules. I’ve added os, rrdtool, and datetime modules. The constants are defined just as before.

    try:
        f = open('/var/log/temp_humidity.log', 'a+')
    except:
        pass

This code opens the log file in append mode so that we can write to it later. It may seem odd to open the file each time through the loop, but this allows log file rotation to work properly. This script only runs every 5 minutes, so opening it within the loop is a reasonable compromise.

    # read the upstairs sensor data
    uh,ut = dht.read_retry(DHT_SENSOR, U_DHT_PIN)
    # read the downstairs sensor data
    dh,dt = dht.read_retry(DHT_SENSOR, D_DHT_PIN)

    if uh is not None and ut is not None and dh is not None and dt is not None:

Querying the sensors is the same as before, but the test for valid values is now done in a single if statement.

        # apply correction factor to DHT22 sensor temperature values
        ut = ut - 0
        dt = dt + 0
        # apply correction factor to DHT22 sensor humidity values
        uh = uh - 3.4
        dh = dh + 3.4
        # convert temp to fahrenheit
        ut = ut * 9/5.0 + 32
        #dt = dt * 9/5.0 + 32
        # log values
        f.write('{0} upstairs {1:0.1f}F {2:0.1f}% downstairs {3:0.1f}C {4:0.1f}%\r\n'.format(time.strftime('%Y-%m-%d %H:%M:%S'), ut, uh, dt, dh))
        f.flush()
        # update database
        data = 'N:' + '{0:.1f}'.format(ut) + ':' + '{0:.1f}'.format(uh) + ':' '{0:.1f}'.format(dt) + ':' + '{0:.1f}'.format(dh)
        #print(data)
        ret = rrdtool.update("%s/temp_humidity.rrd" % (os.path.dirname(os.path.abspath(__file__))),data)
        if ret:
            err = rrdtool.error()
            f.write('{0} {1}\r\n'.format(time.strftime('%Y-%m-%d %H:%M:%S'), err))
            f.flush()

And now we get to the meat of the process. I’ve added code that allows you to apply a correction factor to the values before storing them in the database. My humidity sensors were tracking 6.8% apart, and did that consistently for a couple of days. Since they’re lying on the table about 12″ apart while I test this project, and the difference was constant, I chose to reduce the upstairs value and increase the downstairs value by the same amount. The temperature sensors agreed with a about 0.2 degrees so I left the correction at zero for them – at least for now.

Then we log the values to the log file, and the flush command causes the write to happen immediately. Without it the writes are buffered and may be delayed. I prefer that the log file is current.

To update the rrd database, we build a string containing the values. The data elements are separated by colons, and the first element is “N”, which rrdtool translates to a timestamp for “right now”. The four data values are placed in the string in the same order they were defined when we created the rrd database.

The rrdtool.update command references the temp_humidity.rrd database file, and locates the full path to the file. The variable data, containing the string we constructed earlier, is the only other parameter. The return code from the update process is assigned to the variable “ret” which we then test to ensure the result is good. If not, we log the error and execute the flush, to write the error into the log file immediately.

    else:
        f.write('{0} ERROR - failed to retrieve data from temp/humidity sensor\r\n'.format(time.strftime('%Y-%m-%d %H:%M:%S')))
        f.flush()
        dateTimeObj = datetime.now()
        date_time = dateTimeObj.strftime("%B %-d, %Y at %-I:%M %p")
        port = 587  # For starttls
        smtp_server = "smtp.gmail.com"
        sender_email = "xxxx@xxxxxxxxxxxxxxxxx.com"
        receiver_email = "xxxx@xxxxxxxxx.com"
        password = "xxxxxxxxxxxx"
        message = """\
        Subject: Alert - problem reading temp/humidity sensor

        On {}, there was a problem reading the temperature/humidity sensor.

        If this is not resolved there will be gaps in the data.
        """.format(date_time)
        context = ssl.create_default_context()
        with smtplib.SMTP(smtp_server, port) as server:
            #server.ehlo()  # Can be omitted
            server.starttls(context=context)
            #server.ehlo()  # Can be omitted
            server.login(sender_email, password)
            server.sendmail(sender_email, receiver_email, message)

    f.close()
    time.sleep(300)

This code handles the condition where we do not receive valid values from querying the sensors. First we log the error condition. Then we send an email to the administrator (me) to let me know there has been a problem. Finally, we close the log file and sleep for 300 seconds (5 minutes).

Here’s the complete script. As before, be aware that python is sensitive to indentation and line spacing.

#!/usr/bin/python3

import os
import time
import Adafruit_DHT as dht
import rrdtool
import datetime

DHT_SENSOR = dht.DHT22
U_DHT_PIN = 5
D_DHT_PIN = 6

while True:
    try:
        f = open('/var/log/temp_humidity.log', 'a+')
    except:
        pass

    # read the upstairs sensor data
    uh,ut = dht.read_retry(DHT_SENSOR, U_DHT_PIN)
    # read the downstairs sensor data
    dh,dt = dht.read_retry(DHT_SENSOR, D_DHT_PIN)

    if uh is not None and ut is not None and dh is not None and dt is not None:
        # apply correction factor to DHT22 sensor temperature values
        ut = ut - 0
        dt = dt + 0
        # apply correction factor to DHT22 sensor humidity values
        uh = uh - 3.4
        dh = dh + 3.4
        # convert temp to fahrenheit
        ut = ut * 9/5.0 + 32
        #dt = dt * 9/5.0 + 32
        # log values
        f.write('{0} upstairs {1:0.1f}F {2:0.1f}% downstairs {3:0.1f}C {4:0.1f}%\r\n'.format(time.strftime('%Y-%m-%d %H:%M:%S'), ut, uh, dt, dh))
        f.flush()
        # update database
        data = 'N:' + '{0:.1f}'.format(ut) + ':' + '{0:.1f}'.format(uh) + ':' '{0:.1f}'.format(dt) + ':' + '{0:.1f}'.format(dh)
        #print(data)
        ret = rrdtool.update("%s/temp_humidity.rrd" % (os.path.dirname(os.path.abspath(__file__))),data)
        if ret:
            err = rrdtool.error()
            f.write('{0} {1}\r\n'.format(time.strftime('%Y-%m-%d %H:%M:%S'), err))
            f.flush()

    else:
        f.write('{0} ERROR - failed to retrieve data from temp/humidity sensor\r\n'.format(time.strftime('%Y-%m-%d %H:%M:%S')))
        f.flush()
        dateTimeObj = datetime.now()
        date_time = dateTimeObj.strftime("%B %-d, %Y at %-I:%M %p")
        port = 587  # For starttls
        smtp_server = "smtp.gmail.com"
        sender_email = "xxxx@xxxxxxxxxxxxxxxxx.com"
        receiver_email = "xxxx@xxxxxxxxx.com"
        password = "xxxxxxxxxxxx"
        message = """\
        Subject: Alert - problem reading temp/humidity sensor

        On {}, there was a problem reading the temperature/humidity sensor.

        If this is not resolved there will be gaps in the data.
        """.format(date_time)
        context = ssl.create_default_context()
        with smtplib.SMTP(smtp_server, port) as server:
            #server.ehlo()  # Can be omitted
            server.starttls(context=context)
            #server.ehlo()  # Can be omitted
            server.login(sender_email, password)
            server.sendmail(sender_email, receiver_email, message)

    f.close()
    time.sleep(300)

Next, the pretty part. We’ll build a script to generate graphs using the data we’ve so carefully saved.

Raspberry Pi project – defining the database

I decided to use the rrd (Round Robin Database) to hold the temperature and humidity data from the sensors. The rrd is designed to hold the data in archives that are defined when the database is created. New data will roll in, and old data will roll out, maintaining the time period data for each archive. I’ve defined daily, weekly, monthly, and yearly archives. It’s probably more than I will ever need, but it doesn’t take much space so why not.

With that said, let’s take a look at the database definition.

#!/bin/bash

The file is marked executable, and this line tells the OS what interpreter to use.

# run in the directory where the rrd file should live
rrdtool create temp_humidity.rrd \
--start "12/10/2020" \
--step 300 \

These lines give the database a name (temp_humidity.rrd), define the start date (12/10/2020), and define how often data should be expected to be loaded into the database (every 300 seconds).

DS:uth_dht22:GAUGE:1200:-10:100 \
DS:uhm_dht22:GAUGE:1200:-10:100 \
DS:dth_dht22:GAUGE:1200:-10:100 \
DS:dhm_dht22:GAUGE:1200:-10:100 \

These lines define 4 data fields, named uth_dht22, uhm_dht22, dth_dht22, and dhm_dht22. GAUGE means that the values are stored directly as provided. The 1200 value is the number of seconds the database will wait for a new value – if no data is loaded, an empty set of values will be inserted. This is so that the graphing tool, which we will get to later, will have a complete set of data to display. The final two values define the valid range of data, in this case from -10 to 100.

RRA:AVERAGE:0.5:1:288 \
RRA:AVERAGE:0.5:6:336 \
RRA:AVERAGE:0.5:24:372 \
RRA:AVERAGE:0.5:144:732 \

These lines define four archives, daily, weekly, monthly, and yearly. This set of archives will hold average data for the four data fields. 0.5 is a value used to manage consolidation of the data items – this is recommended by the author so I used the recommended value here. The next field is the number of data points that will be used to construct a consolidated data point. The final field is the number of consolidated data points that will be retained in the archive.

The final two parameters can be confusing, let’s look at them more closely.

For the first archive (daily), each data point is averaged, and 288 are retained. Since we are sampling every 300 seconds, we will get 288 samples per day.

For the second archive (weekly), we average 6 data points to a single data point, and 336 are retained. By consolidating 6 data points into 1, we will have 48 consolidated data points per day. Each week will then have 48 * 7 or 336 data points per week.

For the third archive (monthly), we average 24 data points to a single data point, and 372 are retained. By consolidating 24 data points into 1, we will have 12 consolidated data points per day. Each month will then have 12 * 31 or 372 data points per month.

For the fourth archive (yearly), we average 144 data points to a single data point, and 732 are retained. By consolidating 144 data points into 1, we will have 2 consolidated data points per day. Each year will then have 2 * 366 or 732 data points per year.

RRA:MIN:0.5:1:288 \
RRA:MIN:0.5:6:336 \
RRA:MIN:0.5:24:372 \
RRA:MIN:0.5:144:732 \
RRA:MAX:0.5:1:288 \
RRA:MAX:0.5:6:336 \
RRA:MAX:0.5:24:372 \
RRA:MAX:0.5:144:732 \

The final lines are almost duplicates of the average archives, except that they store minimum (MIN) and maximum (MAX) values.

Here is the complete script.

#!/bin/bash

# run in the directory where the rrd file should live
rrdtool create temp_humidity.rrd \
--start "12/10/2020" \
--step 300 \
DS:uth_dht22:GAUGE:1200:-10:100 \
DS:uhm_dht22:GAUGE:1200:-10:100 \
DS:dth_dht22:GAUGE:1200:-10:100 \
DS:dhm_dht22:GAUGE:1200:-10:100 \
RRA:AVERAGE:0.5:1:288 \
RRA:AVERAGE:0.5:6:336 \
RRA:AVERAGE:0.5:24:372 \
RRA:AVERAGE:0.5:144:732 \
RRA:MIN:0.5:1:288 \
RRA:MIN:0.5:6:336 \
RRA:MIN:0.5:24:372 \
RRA:MIN:0.5:144:732 \
RRA:MAX:0.5:1:288 \
RRA:MAX:0.5:6:336 \
RRA:MAX:0.5:24:372 \
RRA:MAX:0.5:144:732 \

Next, we’ll go back to python to query the sensors and store the data in the rrd database we’ve just defined.